|
|
|
Introduction The Terrain Studio project is the culmination of many other terrain projects. The goal of this project is to take technology developed in previous projects, and to develop a single terrain manipulation environment. It is expected that this project will require refactoring some of the terrain technology and developing new pieces of technology to reach its goals. The initial planned feature set is:
|
 The GUI with no terrain files loaded. VPF derived coastlines and political boundaries can be seen.
|
|
Basic Application
Loading Terrain All that need to be done was to develop a collection class for managing all of the terrain cells together.
|
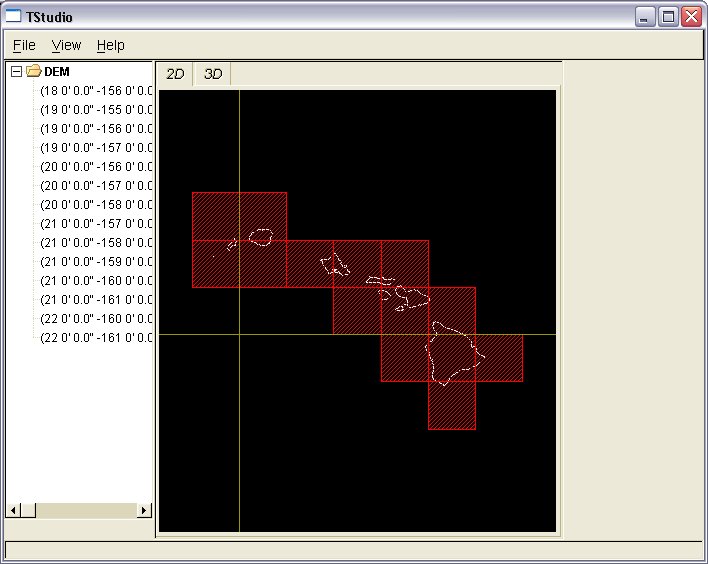 DEMs of Hawaii loaded and displayed as hashed cells over the coastlines.
|
|
2D Display, Coastlines and Boundaries Next, a 2D interactive display of the loaded terrain tiles was added. The 2D display is all done via OpenGL to maintain a interactive manipulation of the display. Initially, all it supported was displaying the tiles as hashed cells, and offered a longitude/latitude overlay on the screen. The user can interactively pan and zoom around the map. Quickly, it was discovered that without some form of geographic reference information, that the 2D display was a bit confusing. To resolve this, I developed a Vector Product Format loader and a bunch of vector feature display classes to support importing coastlines and political boundaries. (Click here to read about the VPF work.) The first image on the right shows the coastlines and political boundaries of Africa. All of the coastlines and political boundaries are stored in a tiled format, with multiple levels of detail to keep performance at a maximum level. A nice side benefit of this is that I can now add VPF loading to the application when I see a need/desire. The coastline, political boundaries, and longitude/latitude overlays can all be toggled on or off.
|
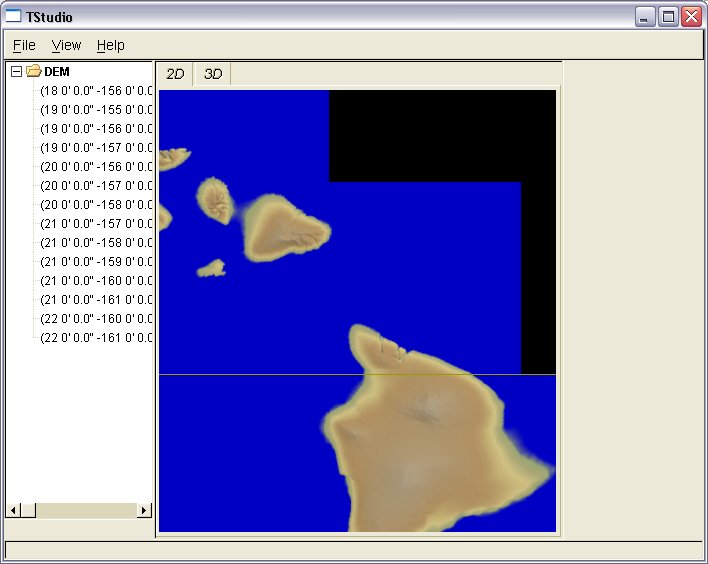 Hawaii DEMs displayed as color shaded height maps. The yellow line seen running through the image is a line of latitude from the latitude / longitude overlay.
|
|
Heightmap Displays & Colormaps Next, the 2D display was extended to support shaded height map displays. A shaded image of each tile is generated on-the-fly. Lighting / shading is added to the images using the height map gradients. These images are then managed internally as 2D texture maps, allowing for extremely fast manipulation of the 2D view. Colored height map displays are only as interesting as the color map used, so the application supports loading XML formatted colormap tables. The Northeastern Ohio image to the right used a custom color map, loaded by the user in the application, to better illustrate the location of the shoreline.
3D Display: Coming Soon
|
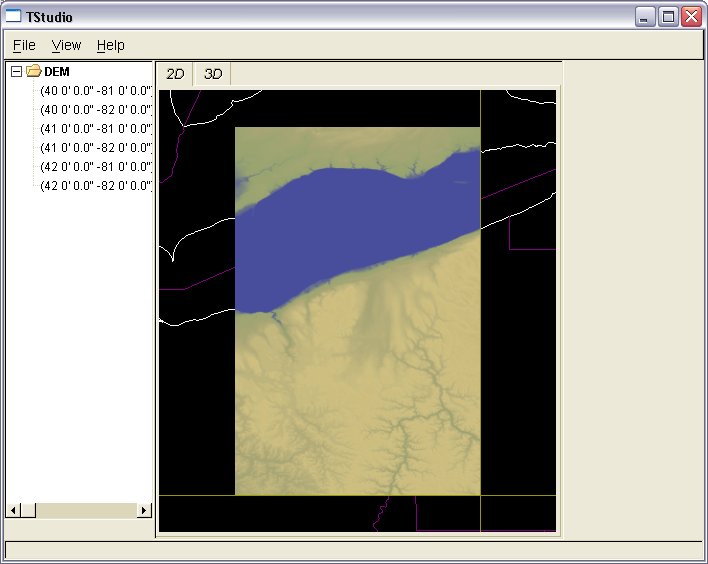 Northeastern Ohio and Lake Erie displayed as color shaded height maps. |
glenn@raudins.com